On a USGS topographic map, “7.5-minute quadrangle” sounds like a measure of time. It is really a description of the patch of Earth on the page: the map covers 7.5 minutes of latitude and 7.5 minutes of longitude. Since each degree contains 60 minutes, each span is one-eighth of a degree.
That neat angular boundary made it possible to organize a vast country into manageable map sheets. It also explains why a quadrangle is not a fixed-size parcel on the ground. The system divides the globe by coordinates, and lines of longitude draw closer together toward the poles. A sheet’s east-west ground span therefore depends on its latitude.
A map series built from coordinate boundaries
USGS topographic maps bring together information about both natural features and human-made ones. Depending on the sheet, readers may find terrain, waterways, roads, buildings, place names and other mapped details. The quadrangle system gives each sheet a defined geographic footprint, making it easier to locate, name and compare maps.
On many familiar USGS 7.5-minute maps in the contiguous United States, the scale is 1:24,000. That ratio means one unit on the map represents 24,000 of the same units on the ground: one inch corresponds to 24,000 inches, or 2,000 feet. A map at that scale can show considerable local detail, but it still cannot include every feature or replace a current navigation source.
The coordinate edges and the printed map scale answer different questions. The quadrangle tells you which geographic slice the sheet covers. The scale tells you how much real-world distance is represented by a given distance on the page. A reader can use both: coordinates to identify a location and scale to estimate distances between mapped features.
Reading the shape of the land
One of the most distinctive elements of a topographic map is its contour lines. Each line connects points at the same elevation. The interval between successive contours is fixed for a particular map, and the map’s marginal information identifies that interval.
Contour spacing offers a quick visual clue. Lines packed close together indicate a steeper slope; widely spaced lines indicate a gentler one. A contour line that closes around itself may mark a hill or a depression, depending on the surrounding pattern and map symbols. Valleys and ridges also leave recognizable shapes in the lines, but interpretation takes care: a contour is not a path or a boundary on the ground. It is a way of representing elevation on a flat sheet.
That distinction matters when planning a walk, studying a watershed or looking at how a road crosses a hillside. A map can make the terrain’s broad form visible, but it does not show every rock, bank or change in surface. The printed symbols, contour interval, scale and date of the map all help a reader judge what the sheet can—and cannot—tell them.
Maps have editions, too
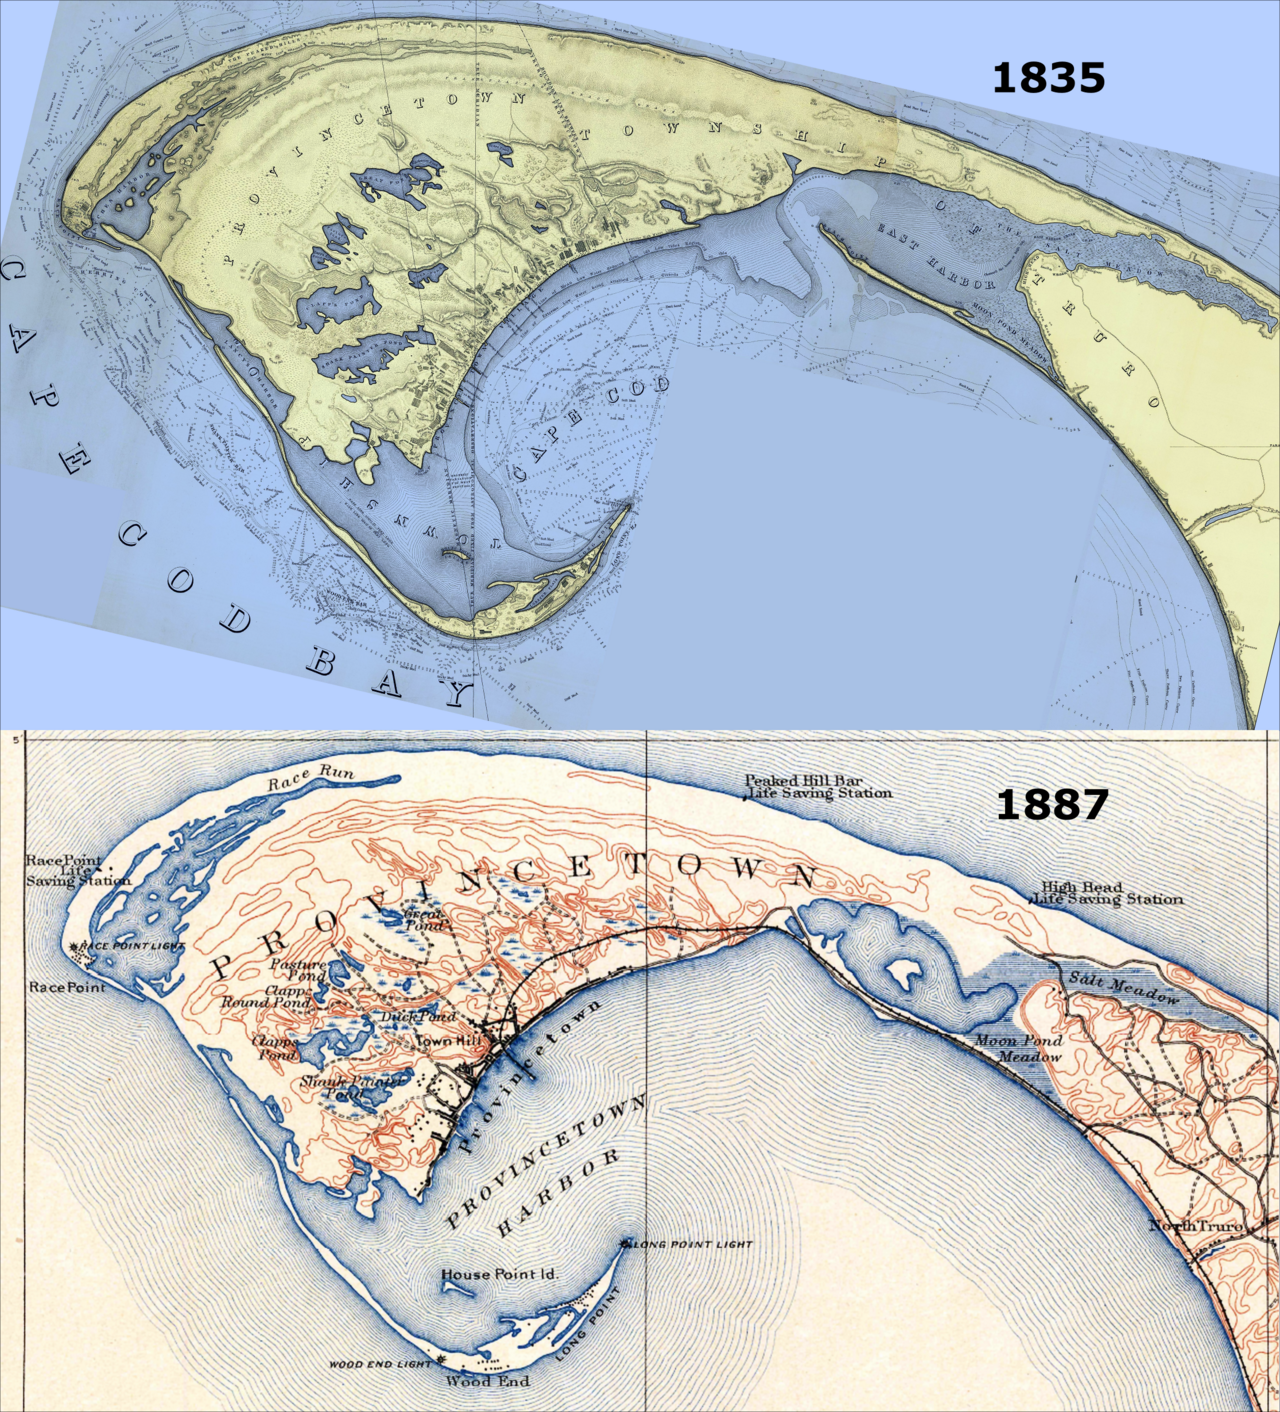
A place changes after a map is made. Roads are rerouted, buildings appear, shorelines shift and names or boundaries may be revised. USGS’s topoView lets readers search and view historical topographic map editions, making it possible to compare how mapped places have changed over time.
Those older sheets are useful records, but they should not be mistaken for current conditions. A historical map may document a road or structure that no longer exists, while a recent change may not yet appear on a particular map. The map’s edition information is therefore part of the evidence, not fine print to ignore.
For current map information, the USGS National Map Viewer provides access to contemporary map data and layers. Digital tools make it easier to zoom, search and switch what is displayed, while a fixed map sheet gives a consistent view of a particular place and scale. Neither format makes the other obsolete: one is useful for exploring current datasets, while the other can provide a dated snapshot or a clear overview of terrain.
Why the small grid still helps
The 7.5-minute system is a reminder that maps are organized representations, not miniature copies of the world. Coordinate boundaries make the country’s terrain easier to divide into sheets; scale compresses distance; contours turn elevation into patterns a reader can interpret. Each choice makes some information easier to see and leaves other detail out.
When you open a USGS quadrangle, start with its title and edition, then check the scale and contour interval. Those details tell you what geographic slice you are looking at, how distance is represented and how much vertical change separates the contour lines. The map becomes more than a collection of symbols: it becomes a carefully bounded view of a changing landscape.